Menu
Menu
Littleton Homes Colorado
Presented by Vicki Mahan
Littleton Homes Colorado
Littleton embodies a diverse array of neighborhoods, catering to a wide spectrum of lifestyles and budgets.
At the heart of Littleton lies its captivating downtown historic area, boasting a collection of turn-of-the-century homes exhibiting various architectural styles. This community is enriched with outdoor areas featuring dining spots and hosting special annual events such as yoga classes, summer concerts, and various garden displays, enhanced by plentiful parks and hiking trails. Trails including the Highline Canal and Lee Gulch, as well as a cycling trail, traverse Littleton.
Residents and visitors alike relish the beauty of Hudson Gardens, with annual festivities like a dazzling Christmas lights display, drum circles, and Halloween events adding to its charm. Other attractions encompass a Mardi Gras celebration, a Main Street block party, the annual Octoberfest celebration, and a street fair each August.
With over 1,500 acres of parks and open space, 35 miles of biking paths, and the Lee Gulch Trail leading to downtown Denver, Littleton offers an outdoor lover's paradise. The neighborhoods, featuring a wide range of homes amidst mature trees, echo a charming ambiance reminiscent of simpler times.
List of Zipcodes in Littleton Homes Colorado
| Zip Code | Zip Code Name | Zip Code Population |
|---|---|---|
| 80120 | ||
| 80121 | ||
| 80122 | Centennial | 32,373 |
| 80123 | Littleton | 46,555 |
| 80124 | ||
| 80125 | ||
| 80126 | Highlands Ranch | 45,786 |
| 80127 | ||
| 80128 | ||
| 80129 | Highlands Ranch | 32,738 |
| 80130 |
Source: Census Bureau
Demographics
State
Colorado
County
Arapahoe County
City
Littleton
Population
734,508
| Zip Code | City | County | State | National | |
|---|---|---|---|---|---|
| Population | 46,555 | 734,508 | 654,892 | 5,759,582 | 331,426,769 |
| Population Density | 3,920.2 | 4,794.0 | 820.6 | 55.5 | 93.8 |
| Percent Male | 50.0% | 50.0% | 49.0% | 49.0% | 49.0% |
| Percent Female | 50.0% | 50.0% | 51.0% | 51.0% | 51.0% |
| Median Age | 41.8 | 37.6 | 38.9 | 40.2 | 39.0 |
| People per Household | 2.3 | 2.2 | 2.5 | 2.8 | 2.6 |
| Median Household Income | $79,982 | $69,660 | $75,120 | $115,942 | $61,963 |
| Average Income per Capital | $44,059 | $45,195 | $40,034 | $50,725 | $33,235 |
Source: Census Bureau
Market Data
| Zip Code | City | County | State | National | |
|---|---|---|---|---|---|
| Median Sale Price | $426,500 | $485,000 | $402,500 | $425,100 | $277,796 |
| Median Age of Home | 45.0 | 56.0 | 47.0 | 39.0 | 49.0 |
| Homes Owned | 69.0% | 46.0% | 61.0% | 67.0% | 58.0% |
| Homes Rented | 28.0% | 46.0% | 34.0% | 23.0% | 31.0% |
| Homes Vacant | 4.0% | 7.0% | 6.0% | 4.0% | 11.0% |
Sources: Census Bureau / Homendo
Source: REcolorado
This free service is provided by your local Agent
How much is your Home worth? Click here to know...
Review current market value estimates for your home, or anyone else, anywhere in the USA.
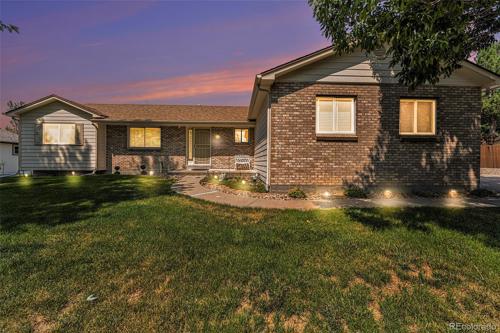
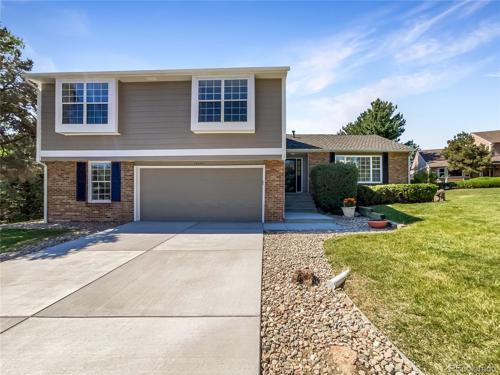
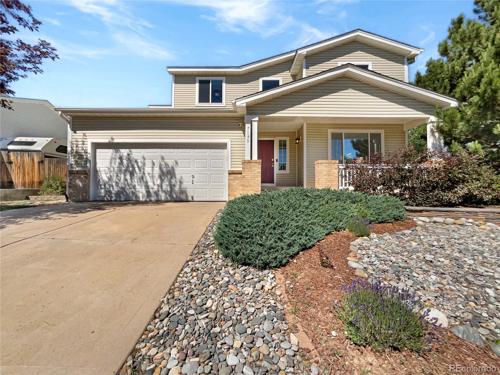
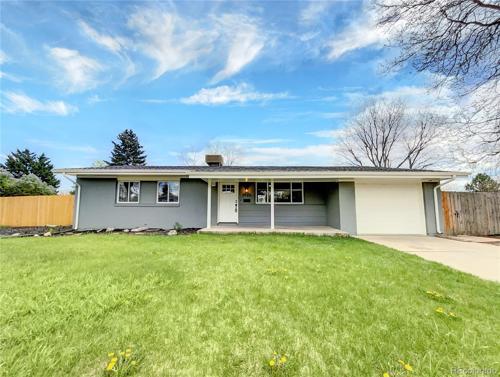
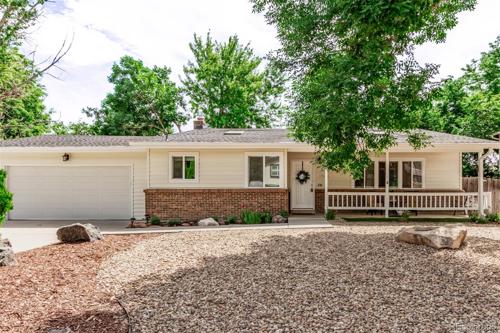
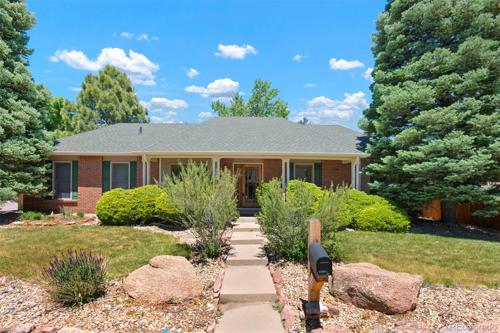
444 properties on market in Littleton Homes Colorado
 Active
Residential
Active
Residential
MLS# 8636350 | 2024-07-27T05:54:16.258Z
 Active
Residential
Active
Residential
MLS# 6283153 | 2024-07-27T03:22:16.225Z
 Active
Residential
Active
Residential
MLS# 7268103 | 2024-07-27T02:27:16.140Z
 Active
Residential
Active
Residential
MLS# 6591831 | 2024-07-27T01:40:17.384Z
 Active
Residential
Active
Residential
MLS# 3826314 | 2024-07-27T01:35:19.218Z
 Active
Residential
Active
Residential
MLS# 2096124 | 2024-07-27T01:35:18.081Z
 Active
Residential
Active
Residential
MLS# 2434374 | 2024-07-27T01:35:17.055Z
 Active
Residential
Active
Residential
MLS# 7156608 | 2024-07-27T01:05:17.595Z
 Active
Residential
Active
Residential
MLS# 7828018 | 2024-07-27T01:05:17.404Z
This free service is provided by your local Agent
Need more listings? Click here to search now...
15 minutes updated and accurate properties direct from your local agent. Home Evaluation. Get Loan Pre-Qualified.

Vicki Mahan
RE/MAX Professionals
6020 Greenwood Plaza Boulevard
Greenwood Village, CO 80111, USA
6020 Greenwood Plaza Boulevard
Greenwood Village, CO 80111, USA
- (303) 641-4444 (Office Direct)
- (303) 641-4444 (Mobile)
- Invitation Code: vickimahan
- Vicki@VickiMahan.com
- https://VickiMahan.com
Contact Me
Valuation Index
- Quality of Life
- Climate & Environment
- Schools & Education
- Safety & Crime
- 91%
- 87%
- 81%
- 29%
Source: Homendo
Quality of Life
Cost of Living
96.0
Health Cost Index
109.0
Commute Time
23.0
Working from Home
4.0%
| Zip Code | City | County | State | National | |
|---|---|---|---|---|---|
| Cost of Living Index | 96.0 | 86.0 | 102.0 | 110.0 | 100.0 |
| Health Cost Index | 109.0 | 96.0 | 114.0 | 119.0 | 100.0 |
| Commute Time | 23.0 | 24.0 | 25.0 | 25.0 | 24.8 |
| Commuting by Bus | 2.0% | 9.0% | 3.0% | 1.2% | 2.1% |
| Commuting by Carpool | 10.0% | 14.0% | 11.0% | 11.0% | 13.5% |
| Commuting by Auto | 84.0% | 73.0% | 81.0% | 80.0% | 79.1% |
| Working at Home | 4.0% | 4.0% | 4.0% | 5.2% | 4.7% |
Source: Census Bureau
Walk Score®
Source: Walk Score®
Climate & Environment
January Average Low Temperature
13.0 °F
July Average High Temperature
86.2 °F
Annual Precipitation (inch)
17 inches
| Zip Code | City | County | State | National | |
|---|---|---|---|---|---|
| January Average Low Temperature | 13.0 °F | 15.2 °F | 15.9 °F | 13.7 °F | 22.6 °F |
| July Average High Temperature | 86.2 °F | 88.0 °F | 89.5 °F | 77.5 °F | 86.1 °F |
| Annual Precipitation (inch) | 17 in. | 16 in. | 18 in. | 19 in. | 38 in. |
Source: NOAA Climate
Schools & Education
Source: Great Schools
Safety & Crime
Violent Crimes
398.9
Property Crimes
2,080
| Zip Code | City | County | State | National | |
|---|---|---|---|---|---|
Violent CrimesCalculated annually per 100,000 residents |
|||||
| Assault | 218.9 | 188.3 | 291.4 | 246.3 | 250.2 |
| Murder | 8.37 | 5.66 | 7.2 | 3.8 | 5.0 |
| Rape | 67.37 | 68.6 | 79.5 | 67.2 | 42.6 |
| Robbery | 52.5 | 76.85 | 164.1 | 63.6 | 81.6 |
Property CrimesCalculated annually per 100,000 residents |
|||||
| Burglary | 621.9 | 427.6 | 461.7 | 348.4 | 340.5 |
| Theft | 1,001 | 531.6 | 2,008.4 | 1,858.3 | 1,549.5 |
| Motor Vehicle Theft | 603.2 | 1,711.4 | 569.1 | 384.0 | 219.9 |
Source: FBI - Crime Data Explorer


Take a photo of this QR code
to keep this website details